| Mann-Whitney U-test |


| The statistical significance between two groups of the entire set of CpG sites is evaluated with the
Mann-Whitney U-test
(also called the Wilcoxon rank-sum test)
that is non-parametric statistical significance test for two distributed samples.
Although, Student's t-test is useful in the same situations as Mann-Whitney U-test,
we adopt not the parametric Student's t-test but the non-parametric Mann-Whitney U-test,
because methylation status does not distribute as a normal distribution, especially in case of hyper- or
hypo-methylation. Two-tailed p-value of the Mann-Whitney U-test is determined from ranks of ratio of
methylated CpGs to all CpGs at each bisulfite sequence (exampled below).
This p-value indicates the independence of distribution of the ratio of CpG methylation to all CpG. Importantly, this test dose not detect differences in the some situations, especially CpG methylation of imprinting regions, because this test only check the difference of the average of two groups. Additionally, the patterns of CpG methylation are not considered. |
|||||||||||||||||||||||||||||||||||||||||||||||||||||||||||||||||||||||||||||||||||||||||||||||||||||||||||||||||||||||||||||||||||||||||||||||||||||||||||||||||||||||||||
| |
|||||||||||||||||||||||||||||||||||||||||||||||||||||||||||||||||||||||||||||||||||||||||||||||||||||||||||||||||||||||||||||||||||||||||||||||||||||||||||||||||||||||||||
| The sample data sets are: | |||||||||||||||||||||||||||||||||||||||||||||||||||||||||||||||||||||||||||||||||||||||||||||||||||||||||||||||||||||||||||||||||||||||||||||||||||||||||||||||||||||||||||
|
|||||||||||||||||||||||||||||||||||||||||||||||||||||||||||||||||||||||||||||||||||||||||||||||||||||||||||||||||||||||||||||||||||||||||||||||||||||||||||||||||||||||||||
|
(This is the analyzed data of the QUMA sample sequence files.) Is this difference between the average ratio of methylation (0.7409 vs. 0.2579) significant? |
|||||||||||||||||||||||||||||||||||||||||||||||||||||||||||||||||||||||||||||||||||||||||||||||||||||||||||||||||||||||||||||||||||||||||||||||||||||||||||||||||||||||||||
|
First, make ranking of the values (methylation ratio) and determine a rank. When two or more values are share the same rank, take an average of the rank values. In the sample data, two sequences are Me-CpGs/CpGs = 3/19 and the rank values are 3 and 4. Then use 3.5 (average of 3 and 4) as the rank. Second, calculate sum of the rank (Rank sum): R1 and R2. |
|||||||||||||||||||||||||||||||||||||||||||||||||||||||||||||||||||||||||||||||||||||||||||||||||||||||||||||||||||||||||||||||||||||||||||||||||||||||||||||||||||||||||||
|
|||||||||||||||||||||||||||||||||||||||||||||||||||||||||||||||||||||||||||||||||||||||||||||||||||||||||||||||||||||||||||||||||||||||||||||||||||||||||||||||||||||||||||
|
Third, determine temporary U-value, U1 and U2, as below. U1 = n1 * n2 + n1 * (n1 + 1) / 2 - R1 = 8.5 U2 = n1 * n2 + n2 * (n2 + 1) / 2 - R2 = 121.5 Take the smaller value of U1 and U2 as the U-value. In this case, U = 8.5 Then determine a two-tailed p-value from the U-value. To determine the p-value, we take the approximation using the normal distribution for the number of sequences above 20. In the case of small sequences (20 and below), we determine the p-value from exact probabilities (Mann Whitney U exact test). |
|||||||||||||||||||||||||||||||||||||||||||||||||||||||||||||||||||||||||||||||||||||||||||||||||||||||||||||||||||||||||||||||||||||||||||||||||||||||||||||||||||||||||||
The normal approximation is performed as: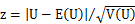 where z is a standard normal deviate, E(U) is the mean of U and V(U) is the variance of U:  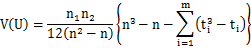 where ti is the number of tied ranks of the position i. At the sample, E(U) = 65, V(U) = 257.812 and z = 3.51879. Then, the two-tailed p-value = 0.0004 is determined from the standard normal distribution (double value for two-tail). |
|||||||||||||||||||||||||||||||||||||||||||||||||||||||||||||||||||||||||||||||||||||||||||||||||||||||||||||||||||||||||||||||||||||||||||||||||||||||||||||||||||||||||||
| Another sample data sets for Mann Whitne U exact test are: | |||||||||||||||||||||||||||||||||||||||||||||||||||||||||||||||||||||||||||||||||||||||||||||||||||||||||||||||||||||||||||||||||||||||||||||||||||||||||||||||||||||||||||
| Table1 | |||||||||||||||||||||||||||||||||||||||||||||||||||||||||||||||||||||||||||||||||||||||||||||||||||||||||||||||||||||||||||||||||||||||||||||||||||||||||||||||||||||||||||
|
|||||||||||||||||||||||||||||||||||||||||||||||||||||||||||||||||||||||||||||||||||||||||||||||||||||||||||||||||||||||||||||||||||||||||||||||||||||||||||||||||||||||||||
| Table2 | |||||||||||||||||||||||||||||||||||||||||||||||||||||||||||||||||||||||||||||||||||||||||||||||||||||||||||||||||||||||||||||||||||||||||||||||||||||||||||||||||||||||||||
|
|||||||||||||||||||||||||||||||||||||||||||||||||||||||||||||||||||||||||||||||||||||||||||||||||||||||||||||||||||||||||||||||||||||||||||||||||||||||||||||||||||||||||||
|
U1 = n1 * n2 + n1 * (n1 + 1) / 2 - R1 = 4 U2 = n1 * n2 + n2 * (n2 + 1) / 2 - R2 = 26 U = min (U1, U2) = 4 |
|||||||||||||||||||||||||||||||||||||||||||||||||||||||||||||||||||||||||||||||||||||||||||||||||||||||||||||||||||||||||||||||||||||||||||||||||||||||||||||||||||||||||||
| When the marginal totals are fixed, there are 179 cases and 11 cases indicated below have U-value not more than the U-value of the sample. | |||||||||||||||||||||||||||||||||||||||||||||||||||||||||||||||||||||||||||||||||||||||||||||||||||||||||||||||||||||||||||||||||||||||||||||||||||||||||||||||||||||||||||
|
|||||||||||||||||||||||||||||||||||||||||||||||||||||||||||||||||||||||||||||||||||||||||||||||||||||||||||||||||||||||||||||||||||||||||||||||||||||||||||||||||||||||||||
| To determine a two-tailed p-value of the significance, make a sum of probabilities of these 11 cases. Then, the two-tailed p-value = 0.0498 | |||||||||||||||||||||||||||||||||||||||||||||||||||||||||||||||||||||||||||||||||||||||||||||||||||||||||||||||||||||||||||||||||||||||||||||||||||||||||||||||||||||||||||